Jeff Cost

Cincinnati Home Loan

  • Home
  • About
    • About Us
    • Privacy Policy
  • Blog
  • Resources
    • First Time Seller Tips
    • First Time Buyer Tips
    • Home Appraisal
    • Loan Checklist
    • Loan Programs
    • Loan Process
    • Mortgage FAQ
    • Mortgage Glossary
    • Get a Rate Quote
    • What to Expect at a Loan Closing: A Step-by-Step Guide
  • Apply Now
    • Online Application
    • Home Purchase
    • Home Refinance
    • Loan Comparison
  • Reviews
    • Leave a Review
  • Contact

Mortgage Rates Drop For The First Time In 4 Weeks

August 31, 2012 by Jeff Cost

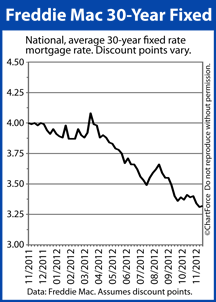
Freddie Mac mortgage rates

After 4 weeks of rising costs, Cincinnati mortgage rates finally recede.

According to Freddie Mac’s weekly Primary Mortgage Market Survey, the average 30-year fixed rate mortgage rate dropped 7 basis points to 3.59% this week. Depending on where you live, however, you may find that your offered mortgage rates varies. Freddie Mac’s “published rate” is a national average based on a survey of more 125 banks.

The rates you receive as an individual vary by bank, and vary by region.  

Mortgage applicants in the North Central Region were most likely to get the lowest rates of all applicants nationwide last week. By contrast, applicants in the Southeast Region were most likely to get the highest rates.

Average mortgage rates in the five U.S. regions, as tracked by Freddie Mac :

  • Northeast Region : 3.59 percent for a 30-year fixed rate mortgage
  • West Region : 3.58 percent for a 30-year fixed rate mortgage
  • Southeast Region : 3.64 percent for a 30-year fixed rate mortgage
  • North Central Region : 3.57 percent for a 30-year fixed rate mortgage
  • Southwest Region : 3.61 percent for a 30-year fixed rate mortgage

Across all 5 regions, mortgage rates were quoted with an accompanying 0.6 discount points, on average, plus a full set of closing costs. 1 discount point is equal to one percent of your loan size. Closing costs vary by county.

One year ago, the 30-year fixed rate mortgage rate averaged 4.22%. Today, it averages 3.59%. This 63 basis point difference yields a $36 monthly savings per $100,000 borrowed. 

On a $250,000 mortgage, that’s $1,080 in savings per year.

If watched mortgage rates rise through August and felt as if you missed the market bottom, consider this week your second chance. The 30-year fixed rate mortgage does remains above its all-time low of 3.49 percent, but this week’s drop in rates in encouraging. It’s the biggest one-week drop in rates in more than 3 months.

Talk to your loan officer about how today’s mortgage rates can work for your budget. 

Filed Under: Mortgage Rates Tagged With: 30-Year Fixed, Freddie Mac, PMMS

Pending Home Sales Index Makes New High For 2012

August 30, 2012 by Jeff Cost

Pending Home Sales Index

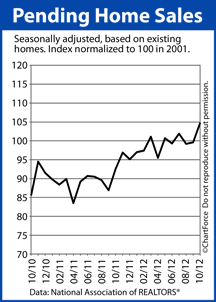
In July, the third time this year, the Pending Home Sales Index crossed its benchmark value of 100, moving to 101.7. 

A “pending home sale” is a home under contract to sell, but not yet sold. Data for the index is collected by the National Association of REALTORS® and published monthly.

The rise in July’s Pending Home Sales Index reading is important for two reasons — both of which highlight a U.S. housing market in recovery. Buyer and sellers in Cincinnati and across the country would do well to pay attention.

First, the Pending Home Sales Index is at its highest point since April 2010, the last month of that year’s federal home buyer tax credit.

From this, we can infer that the rate at which homes are selling in Kentucky and nationwide is approaching the same “stimulated” levels that the tax credit afforded two-plus years ago. The difference is that today there are no buyer tax incentives.

The Pending Home Sales Index readings have climbed steadily since the tax credit’s expiration, too :

  • July 2010 : 78.4 reading
  • July 2011 : 90.5 reading
  • July 2012 : 101.7 reading

Second, because the Pending Home Sales Index is a relative index; and, because it was assigned a value of 100 when it was launched by the real estate trade group in 2001, when the PHSI reads higher than 100, it tells us that homes are going under contract at a faster pace than they did during the index’s first year.

2001 was a strong year for the U.S. housing market. 2012 is on path to be a stronger one.

80% of homes go to closing within two months of contract so, based on the July 2012 Pending Home Sales Index, we should expect for the Existing Home Sales report to rise through the rest of summer and into fall. Home supplies may drop and home prices may rise.

The housing market has expanded slowly and steadily dating to October 2011. Based on last month’s PHSI, that momentum will continue. 

Filed Under: Housing Analysis Tagged With: NAR, Pending Home Sales Index, PHSI

New Home Sales Reach Multi-Year High

August 29, 2012 by Jeff Cost

New Home Sales 2010-2012The market for newly-built homes remains strong.

As reported by the U.S. Department of Commerce, 372,000 new homes were sold in July on a seasonally-adjusted, annualized basis. A “new home” is a home that can be considered new construction.

July’s New Home Sales report highlights what today’s buyers of new construction and the nation’s home builders have witnessed for themselves already — that the market for newly-built homes is improving in Columbus and nationwide.

The number of new homes sold in July on a seasonally-adjusted, annualized basis matches the tally from May 2012, and is the highest reading since April 2010, the last month of that year’s federal home buyer tax credit.

The South Region continues to account for the majority of new construction sales, posting a 48% market share in July. South Region sales were up 9.1 percent as compared to one year ago. The other 3 regions posted higher sales volume as well :

  • South Region : +9.1% from July 2011
  • Northeast Region : +30.4% from July 2011
  • Midwest Region : +21.7% from July 2011
  • West Region : +63.8% from July 2011

Also noteworthy is that the increase in new home sales is coming at a time when new home supplies are slipping.

At the end of July 2012, there were just 142,000 new homes for sale nationwide. This is the smallest new home housing stock in at least 7 years, and a signal that buyers are buying homes faster than builders can build them. At the current pace of sales, the national supply of new homes would sell out in 4.6 months.

Because economists believe that a 6.0-month supply represents a market in balance, the current new home market is decidedly a “sellers market”. Buyers throughout Ohio should expect higher new home prices ahead.

Dating back to October 2011, the housing market has shown slow, steady growth. Home prices have moved higher and so has builder confidence. If you’re in the market for new construction consider going into contract soon. The longer you wait to buy, the more you may be asked to pay.

Filed Under: Housing Analysis Tagged With: Builder Confidence, New Home Sales, New Home Supply

  • « Previous Page
  • 1
  • …
  • 1101
  • 1102
  • 1103
  • 1104
  • 1105
  • …
  • 1201
  • Next Page »

Jeff Cost
Sr. Loan Officer

Cincinnati, OH Mortgage Lender
NMLS# 21688


jeffrey.cost@ccm.com

Call (513) 403-6260
Fax (941) 567-5222

Cross Country Mortgage

How can I help?

Connect with Me!

Browse Articles by Category

The Latest Articles

  • What Mortgage Lenders Really Look At Before Approving Your Loan
  • Steps to Take Now to Build Your Credit for a Home Purchase Next Year
  • What’s Ahead For Mortgage Rates This Week – November 3rd, 2025
  • Comparing Biweekly Payments and Lump Sum Payments to See Which Saves More
nmlsconsumeraccess.org
Equal Housing Lender

Our Location

CrossCountry Mortgage, LLC
4050 Executive Park Drive, Suite 220
Cincinnati, OH 45242

Personal NMLS21688 Branch NMLS2458257
Company NMLS3029

Copyright © 2025 · Powered by MySMARTblog

Copyright © 2025 · Genesis Sample Theme on Genesis Framework · WordPress · Log in