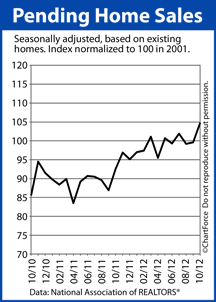
 Homes were sold at a furious pace last month.
According the National Association of REALTORS® (NAR), the Pending Home Sales Index rose 5.2 percent in October, crossing the benchmark 100 reading, and moving to 104.8.
It’s a 5-point improvement from September’s revised figure and the highest reading April 2010 — the last month of that year’s federal home buyer tax credit.
October also marks the 18th consecutive month during which the index showed year-to-year gains.
As a housing market metric, the Pending Home Sales Index (PHSI) differs from most commonly-cited housing statistics because, instead of reporting on what’s already occurred, it details what’s likely to happen next.
The PHSI is a forward-looking indicator; a predictor of future sales. It’s based on signed real estate contracts for existing single-family homes, condominiums, and co-ops. Later, when the contract leads to a closing, the “pending” home sale is counted in NAR’s monthly Existing Home Sales report.
Historically, 80 percent of homes under contract, and thus counted in the Pending Home Sales Index, will go to settlement within a 2-month period, and a significant share of the rest will close within months 3 and 4. The PHSI is a predictor of Existing Home Sales.
Regionally, the Pending Home Sales Index varied in October 2012 :
- Northeast Region : 79.2; +13 percent from October 2011
- Midwest Region : 104.4; +20 percent from October 2011
- South Region : 117.3; +17 percent from October 2011
- West Region : 105.7; +1 percent from October 2011
A Pending Home Sales Index reading of 100 or higher denotes a “strong” housing market.
Of course, with rising home sales comes rising home values. 2012 has been characterized by strong buyer demand amid falling housing supplies. It’s one reason why the Case-Shiller Index and the FHFA’s Home Price Index are both showing an annual increase in home prices. Plus, with mortgage rates low as we head into December, the traditional “slow season” for housing has been anything but.
The housing market in Cincinnati is poised to end 2012 with strength. 2013 is expected to begin the same way.
