 The economic recovery continues nationwide, but the recovery’s an uneven one.
Some metropolitan areas are faring very well this year, posting measurable gains in both employment and housing. Other metropolitan areas, by contrast, are struggling.
To help identify those markets in which growth is occurring, the National Association of Homebuilders created the Improving Market Index, a metric analyzing three separate, independently-collected data series “indicative of improving economic health”.
The IMI’s three collected data series are :
- Employment Growth (as published by the Bureau of Labor Statistics)
- Home Price Growth (as published by Freddie Mac)
- Single-Family Housing Growth (as published by the Census Bureau)
A metropolitan area is considered to be “improving” if all three indicators show growth at least six months after the respective area’s most recent trough, or “bottoming out”.
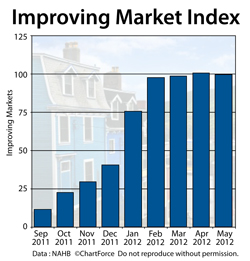
In May, there are exactly 100 U.S. markets that qualify for the NAHB’s Improving Market Index, down from 101 last month but higher by more than 800% from the reading in September 2011, the index’s inaugural release.
17 areas were added to the Improving Market Index list this month including Phoenix, Arizona; Ann Arbor, Michigan; and Bend, Oregon. 18 areas were removed from the May IMI.
83 metropolitan areas remained from April.
There is little actionable information in the Improving Markets Index but the report does a good job of highlighting how “real estate markets” can’t be summarized on a national level and remain relevant to everyday home buyers and sellers across Kentucky and nationwide. For example, Fort Collins, Colorado is listed as an Improving Market. However, Greeley, Colorado — located just 30 miles away — was just downgraded from the same list.
Home values and economies vary by region, by state, by city, by neighborhood, and even by street.
The complete Improving Markets Index can be viewed at the NAHB website but for the best read of what’s happening in your neighborhood, talk to a local real estate agent.
