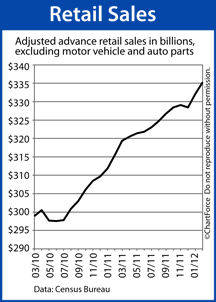
 The U.S. economy is expanding, fueled by a renewed consumer optimism and increased consumer spending.
As reported by the Census Bureau, Retail Sales in February, excluding cars and auto parts, rose 1 percent to $335 billion as 11 of 13 retail sectors showed improvement last month.
February markets the 19th time in twenty months that U.S. Retail Sales increased on a month-over-month basis.
Unfortunately, what’s good for the economy may be bad for Louisville home buyers and mortgage rate shoppers. Home affordability is expected to worsen as the U.S. economy improves.
The connection between Retail Sales and home affordability is indirect, but noteworthy — especially given today’s broader market conditions.
First, let’s talk about affordability.
Last week, the National Association of REALTORS® released its monthly Housing Affordability Index, showing that homes are more affordable to everyday home buyers than at any time in recorded history. For buyers with median earnings buying median-priced homes, monthly payments now comprise just 12.1% of the monthly household income.
The real estate trade group considers 25% to be the benchmark for home affordability. Today’s payment levels are less than half of that.
The reasons why today’s homes are so affordable are three-fold :
- Home prices remain relatively low as compared to peak pricing
- Fixed- and adjustable-rate mortgage rates remain near all-time lows
- Average earnings are increasing nationwide
Rising Retail Sales, however, can derail the trend. This is because Retail Sales measures consumer spending and consumer spending accounts for roughly 70 percent of the U.S. economy. As the economy expands, the forces that combined to raise home affordability so high begin to wane.
First, in a recovering economy, mortgage rates tend to rise and, throughout 2012 and 2013, home prices are expected do the same. Second, as average earnings increase, it can spur inflation which is bad for mortgage rates, too.
Home affordability is at all-time highs today. But, in part because of February’s Retail Sales data, we should not expect these levels to last. Mortgage rates are higher by 1/4 percent since the Retail Sales data was released — roughly $16 per $100,000 borrowed — and are expected to rise more throughout the spring home purchase season.
Retail Sales are up 6 percent from a year ago.
