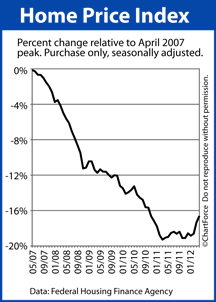
The Federal Home Finance Agency’s Home Price Index shows home values up 0.8% in April on a monthly, seasonally-adjusted basis.
April marks the third consecutive month during which home values increased and the index is now up 3 percent from last year at this time.
As a home buyer in Cincinnati , it’s easy to look at the Home Price Index and believe that its recent, sustained climb is proof of a broader housing market recovery. Ultimately, that may prove true. However, we cannot base our buy-or-sell decisions on the HPI because, like the private-sector Case-Shiller Index, the Home Price Index is flawed.
There are three main flaws in the FHFA’s Home Price Index. They cannot be ignored.
First, the FHFA Home Price Index’s sample set is limited to homes with mortgages backed by Fannie Mae or Freddie Mac. By definition, therefore, the index excludes homes with mortgages insured by the FHA.
5 years ago, this wasn’t such an issue because the FHA insured just 4 percent of mortgage. Today, however, the FHA’s market share is estimated to exceed 30 percent. This means this the HPI excludes more than 30% of U.S. homes from its calculations right from the start.
The index also excludes homes backed by the VA; jumbo mortgages not securitized through the government; and, portfolio loans held by individual banks.
Second, the FHFA Home Price Index is based on the change in price of a home on consecutive home sales. Therefore, it’s sample set cannot include sales of new home sales, nor can it account for purchases made with cash because cash purchases require no mortgage.
Cash purchases were 29% of the home resale market in April.
Third, the Home Price Index is on a 60-day delay.
The report that home values are up 0.8% accounts for homes that closed two months ago, and with contracts from 30-75 days prior to that. In other words, the Home Price Index is measuring housing market activity from as far back as January.
Reports such as the Home Price Index are helpful in spotting long-term trends in housing but data from January is of little help to today’s OH home buyers and sellers. It’s real-time data that matters most and the best place to get real-time housing market data isn’t from a national home valuation report — it’s from a local real estate agent.
