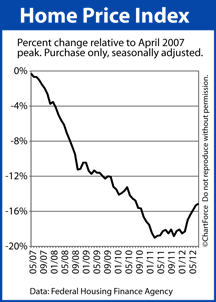
 Tuesday, the Federal Home Finance Agency’s Home Price Index (HPI) showed home values rising 0.2% on a seasonally-adjusted basis between June and July 2012, and moving +3.7% on an annual basis.
Home values have not dropped month-to-month since January of this year — a span of 6 months.
For today’s home buyers and sellers throughout Cincinnati , though, it’s important to recognize on what the HPI is actually reporting.
Or, stated differently, on what the HPI is not reporting. The Home Price Index is based on home price changes of some homes, of certain “types”, with specific mortgage financing only.
As such, it excludes a lot of home sales from its results which skews the final product. We don’t know if home values are really up 0.2% this month — we only know that’s true for the home that the HPI chooses to track.
As an example of how certain homes are excluded, because the HPI is published by the Federal Housing Finance Agency and because the FHFA gets its access to home price data from Fannie Mae and Freddie Mac, it’s upon data these two entities upon which the Home Price Index is built.
Home price data from the Federal Housing Administration (FHA), from local credit unions, and from all-cash sales, for example, are excluded from the HPI because the FHFA has no awareness that the transaction ever happened.
In 2006, this may not have been a big deal; the FHA insured just 4 percent of the housing market at the time. Today, however, the FHA is estimated to insure more than 20% of new home purchases. Furthermore, in August, more than 1 in 4 sales were made with cash.
None of these home sales were included in the HPI.
Furthermore, the Home Price Index excludes certain home types from its findings.
Home sales of condominiums, cooperatives, multi-unit homes and planned unit developments (PUD) are not used in the calculation of the HPI. In some cities, including Chicago and New York City, these property types represent a large percentage of the overall market. The HPI ignores them.
Like other home-value trackers, the Home Price Index can well highlight the housing market’s broader, national trends but for specific home price data about a specific home or a ZIP code, it’s better to talk with a real estate agent with local market knowledge.
Since peaking in April 2007, the Home Price Index is off 16.4 percent.
