Jeff Cost

Cincinnati Home Loan

  • Home
  • About
    • About Us
    • Privacy Policy
  • Blog
  • Resources
    • First Time Seller Tips
    • First Time Buyer Tips
    • Home Appraisal
    • Loan Checklist
    • Loan Programs
    • Loan Process
    • Mortgage FAQ
    • Mortgage Glossary
    • Get a Rate Quote
    • What to Expect at a Loan Closing: A Step-by-Step Guide
  • Apply Now
    • Online Application
    • Home Purchase
    • Home Refinance
    • Loan Comparison
  • Reviews
    • Leave a Review
  • Contact

What’s Ahead For Mortgage Rates This Week : October 3, 2011

October 3, 2011 by Jeff Cost

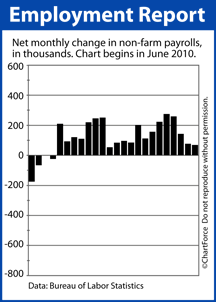
Jobs report due this weekMortgage markets deteriorated last week as optimism for a Greek rescue package increased, and as U.S. consumers showed that, despite falling income levels, spending will not be slowed.

As reported by the government, household income dropped in August, falling 0.1 percent and marking the first monthly dip since 2009. Yet, consumer spending still rose, tacking on 0.1 percent. Consumer spending accounts for 70 percent of the U.S. economy.

In addition, last week Eurozone leaders approved a funding increase for the European “bailout fund”. The additional funding raises the probability that Greece will avoid default on its sovereign debt, and that other nations including Italy, Spain, Ireland and Portugal will avoid similar default scenarios.

The moves drew money away from mortgage markets, causing rates to rise.

Conforming mortgage rates in Kentucky climbed last week, stymying would-be refinancers in search of the lowest mortgage rates in 60 years. Nationally, fixed rate mortgages were higher by as much as 0.25%.

This week, rates may continue climbing.

First, European leaders are expected to finalize the details of a Greek aid package, a move that would reverse the “safe haven” bid which has played a large role in keeping U.S. mortgage rates lows.

Second, the jobs report is due.

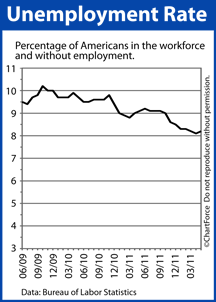
Economists are expecting 65,000 net new jobs in September and a slight increase in the Unemployment Rate. A deviation from either consensus expectation should cause mortgage rates to move. 

If it’s shown that more than 65,000 jobs were created last month, mortgage rates should rise on the prospect of a recovering economy. To the contrary, though, if it’s shown that fewer than 65,000 jobs were created, mortgage rates should fall.

The jobs report will be released Friday morning, 8:30 AM ET.

If you’re shopping for a mortgage right now, be aware that rates could move in either direction, but there’s a lot more room for rates to rise than to fall. The “safe” course of action is to lock a rate today.


Filed Under: Mortgage Rates Tagged With: Eurozone, Greece, Non-Farms Payrolls

Despite Low Rates, Pending Home Sales Slip In August

September 30, 2011 by Jeff Cost

Pending Home Sales graphDespite the lowest mortgage rates of all-time, home buyers are slowing the pace at which they’re buying homes.

According to the National Association of REALTORS®, on a seasonally-adjusted basis, the Pending Home Sales Index fell 1 percent in August.

The Pending Home Sales Index measures homes under contract, but not yet sold, nationwide. In this respect, the Pending Home Sales Index is a forward-looking housing market indicator; a predictor of future home sales.

It’s one of the few national indices that “looks ahead” to future market conditions. Most housing data, by contrast, describes past events.

On a regional basis, only the South Region showed improvement in August’s Pending Home Sales Index report : 

  • Northeast Region: -5.8%
  • Midwest Region : -3.7%
  • South Region : +2.6%
  • West Region : -2.4%

That said, even the value of regional data can be questioned. Like all things in real estate, the number of homes going under contract will vary on the local level.

For example, in the Northeast Region where pending home sales slipped in August, there are close to a dozen states. Some of those states performed better than others, and there is no doubt that cities and towns exist in the region in which pending home sales actually climbed.

As a national/regional report, the Pending Home Sales Index cannot show local market data and, for that reason, it’s somewhat irrelevant to everyday buyers and sellers in Columbus. If you’re in the market to buy or sell a home today, it’s your local housing market data that matters to you. 

We watch the Pending Home Sales Index because it paints a broad picture of housing nationwide. To get local market conditions, though, you’ll want to talk with a local real estate professional.

Filed Under: Housing Analysis Tagged With: Mortgage Rates, National Association of REALTORS, Pending Home Sales Index

Case-Shiller Index : 85% Of Tracked Cities Showed Home Price Improvement In July

September 29, 2011 by Jeff Cost

Case-Shiller monthly change (June - July 2011)

Standard & Poors released its monthly Case-Shiller Index this week. The Case-Shiller Index measures home price changes from month-to-month, and year-to-year, in 20 select U.S. cities. It also reports a “national” index; a composite of the values in said cities.

The most recent Case-Shiller Index shows a 0.9% rise in home values from June to July 2011. Home values were higher in 17 of the 20 tracked cities. Only Phoenix and Las Vegas fell. Denver was flat.

Also noteworthy is that, of all of the Case-Shiller cities, Detroit posted the strongest 1-year, home price improvement. As compared to July 2010, home values are higher by 1.2 percent in Detroit. This bests even Washington, D.C. — long-believed to be the nation’s healthiest housing market.

That said, we should be careful of the conclusions we draw from July’s Case-Shiller Index — both on a city-wide level, and on a national level. This is because, as with most “home price trackers”, the Case-Shiller Index has flaws in its methodology. 

The first Case-Shiller Index flaw is its limited scope. Although it’s purported to be a “nationa”l housing index, the data that comprises the monthly Case-Schiller Index is sourced from just 20 U.S. cities. These 20 cities represent just 0.6% of the more than 3,100 municipalities nationwide.

The second Case Shiller Index flaw is that the sample sets include single-family, detached homes only. iCondominiums, multi-unit homes, and new construction are specifically excluded from the Case-Shiller Index.

In some markets, “excluded” home types outnumber included ones.

And, lastly, the Case-Shiller Index is flawed in that it takes 2 months to gather data and report it. It’s nearly October, yet we’re still discussing the real estate market as it existing in July. For buyers and sellers in Cincinnati , July in ancient history. 

The Case-Shiller Index is useful for tracking long-term trends in housing, but does little to help individuals with their choices to buy or sell a home. For relevant, recent real estate data, talk to a real estate agent in your market. Real estate agents are often the best source for real-time, real estate data.

Filed Under: Housing Analysis Tagged With: Case-Shiller Index, Home Values

  • « Previous Page
  • 1
  • …
  • 1142
  • 1143
  • 1144
  • 1145
  • 1146
  • …
  • 1174
  • Next Page »

Jeff Cost
Sr. Loan Officer

Cincinnati, OH Mortgage Lender
NMLS# 21688


jeffrey.cost@ccm.com

Call (513) 403-6260
Fax (941) 567-5222

Cross Country Mortgage

How can I help?

Connect with Me!

Browse Articles by Category

The Latest Articles

  • The One Number More Important Than Your Credit Score for Mortgage Approval
  • How to Talk to Your Parents About Co-Signing a Mortgage
  • Understanding the Fear Behind Mortgage Debt and How to Move Past It
  • What’s Ahead For Mortgage Rates This Week – July 14th, 2025
nmlsconsumeraccess.org
Equal Housing Lender

Our Location

CrossCountry Mortgage, LLC
4050 Executive Park Drive, Suite 220
Cincinnati, OH 45242

Personal NMLS21688 Branch NMLS2458257
Company NMLS3029

Copyright © 2025 · Powered by MySMARTblog

Copyright © 2025 · Genesis Sample Theme on Genesis Framework · WordPress · Log in