Jeff Cost

Cincinnati Home Loan

  • Home
  • About
    • About Us
    • Privacy Policy
  • Blog
  • Resources
    • First Time Seller Tips
    • First Time Buyer Tips
    • Home Appraisal
    • Loan Checklist
    • Loan Programs
    • Loan Process
    • Mortgage FAQ
    • Mortgage Glossary
    • Get a Rate Quote
    • What to Expect at a Loan Closing: A Step-by-Step Guide
  • Apply Now
    • Online Application
    • Home Purchase
    • Home Refinance
    • Loan Comparison
  • Reviews
    • Leave a Review
  • Contact

Finding Truth In September’s Housing Starts Report

October 20, 2011 by Jeff Cost

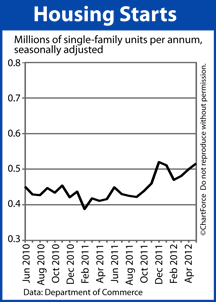
Housing Starts 2009-2011Headlines in newspapers can be misleading — especially with respect to housing figures. Media coverage of the most recent Housing Starts data serves as an excellent illustration.

Wednesday, the Census Bureau released its September Housing Starts report. In it, the government said that national Housing Starts rose 15 percent in September as compared to August 2011, tallying 658,000 units on a seasonally-adjusted annualized basis.

The September reading is the highest monthly reading since April 2010, the last month of last year’s home buyer tax credit.

The sudden surge in starts is big news for a housing market that has struggled of late, and the press was eager to carry the story. Here is a sampling of some headlines:

  • U.S. Housing Starts Rise 15%, Hit 17-Month High (MarketWatch)
  • Home Building Jumps 15% in September (ABC)
  • New Construction Surges In September (LA Times)

These headlines are each accurate. However, they’re also misleading.

Yes, Housing Starts did surge in September, but if we remove the “5 or more units” grouping from the Census Bureau data — the catgory that includes apartment buildings and condominium structures — we’re left with Single-Family Housing Starts and Single-Family Housing Starts rose just 1.7 percent last month.

That’s a good number, but hardly a great one. And for home buyers and sellers throughout Louisville and nationwide, it’s the Single-Family Housing Starts that matter most. Individuals like you and I don’t buy entire apartment buildings. Most often, we buy single-family homes. Therefore, that’s the data for which we should watch.

The good news is that media tales work in both directions.

Building Permits dropped 5 percent last month when the volatile 5-unit-or-more-units category was included from the math. Isolating for single-family homes, we find that permits were unchanged.

This is good housing because 82% of homes begin construction within 60 days of permit-issuance, hinting at a steady, late-fall housing market.

Filed Under: Housing Analysis Tagged With: Building Permits, Census Bureau, Housing Starts

Homebuilder Confidence Rises on Surging Sales Volume, Foot Traffic

October 19, 2011 by Jeff Cost

Homebuilder Confidence 2009-2011Homebuilder confidence is rebounding sharply.

Just one month after falling to a multi-month low, the Housing Market Index rebounded four points to 18 for October. It’s the highest reading for the HMI since May 2010 — the month after last year’s homebuyer tax credit expiration.

The Housing Market Index is published monthly by the National Association of Homebuilders and is scored on a scale of 1-100. Readings above 50 indicate favorable conditions for homebuilders. Readings below 50 indicate unfavorable conditions.

The index has been below 50 since May 2006 — a 66-month streak.

The Housing Market Index is a composite reading; the result of three separate surveys sent to home builders each month. Builders are asked about current single-family home sales volume; projected single-family home sales volume over the next 6 months; and current “foot traffic”.

In October, builder responses were stronger in all 3 categories :

  • Current single-family sales : 18 (+4 from September)
  • Projected single-family sales : 24 (+7 from September)
  • Buyer foot traffic : 14 (+3 from September)

Meanwhile, of particular interest to today’s Louisville home buyers is that builders expect volume to surge over the next two seasons. And, with current sales volume rising and foot traffic strengthening, the fall and winter months could be strong ones in the new homes market.

In addition, the builder trade group press release states that rising costs for materials are squeezing building profit margins.

For buyers, it all adds up higher home prices ahead. As builders grow more confident about the housing market, they’re less likely to make concessions on pricing or upgrades. Rising building costs fortify that argument. The “great deal” will be tougher to negotiate. 

At least mortgage rates are low.

Low mortgage rates are keeping homes affordable in Kentucky and nationwide. If you’re looking for the right time to buy new construction, therefore, this month may be it.

Filed Under: Housing Analysis Tagged With: HMI, Housing Market Index, National Association of Homebuilders

Foreclosure Rate Drops For The 12th Straight Month

October 18, 2011 by Jeff Cost

Foreclosures by state September 2011Foreclosure activity continues to slow throughout the United States.

According to data from RealtyTrac, a national foreclosure-tracking firm, the number of foreclosure filings dipped below 215,000 in September 2011, a 6 percent decrease from August.

A “foreclosure filing” is defined as any foreclosure-related action including Notice of Default, Scheduled Auction, or Bank Repossession.

September marks the 12th straight month in which foreclosure filings fell year-over-year.

There are several reasons why foreclosure filings are down, including an increase in the amount of time it takes banks to move a foreclosure through its pipeline. It now takes a nationwide average of 336 days from the date of initial default notice to bank repossession.

Some states work quicker than others, however, because of a combination of state law and personnel.

Homes in New York take an average of 986 days to foreclose, for example, the longest in the country. Homes in Texas foreclose the quickest, registering just 86 days.

As in prior months, bank repossessions remain concentrated by state. Just 6 states accounted for half of the country’s REO last month:

  • California : 16.6 percent
  • Georgia : 8.5 percent
  • Florida : 8.3 percent
  • Texas : 6.2 percent
  • Michigan : 6.1 percent
  • Illinois : 5.2 percent

Collectively, these 6 states represent just 36 percent of the nation’s population.

By contrast, the bottom 6 states were home to just 192 repossessions last month — 0.3% of the national total. Those 6 states were Alaska, Wyoming, District of Columbia, North Dakota, South Dakota, and Vermont.

For home buyers in Columbus , shopping for foreclosed properties can be an excellent way to get “a deal”. Foreclosed homes typically sell at discounts as compared to “non-foreclosed” homes, but are often sold “as-is”. This means that homes listed for sale may be defective or out-of-code.

Before placing a bid on a foreclosed home, make sure that you’re represented by an experienced real estate professional. 

Filed Under: Housing Analysis Tagged With: Foreclosure, RealtyTrac, REO

  • « Previous Page
  • 1
  • …
  • 1138
  • 1139
  • 1140
  • 1141
  • 1142
  • …
  • 1174
  • Next Page »

Jeff Cost
Sr. Loan Officer

Cincinnati, OH Mortgage Lender
NMLS# 21688


jeffrey.cost@ccm.com

Call (513) 403-6260
Fax (941) 567-5222

Cross Country Mortgage

How can I help?

Connect with Me!

Browse Articles by Category

The Latest Articles

  • The One Number More Important Than Your Credit Score for Mortgage Approval
  • How to Talk to Your Parents About Co-Signing a Mortgage
  • Understanding the Fear Behind Mortgage Debt and How to Move Past It
  • What’s Ahead For Mortgage Rates This Week – July 14th, 2025
nmlsconsumeraccess.org
Equal Housing Lender

Our Location

CrossCountry Mortgage, LLC
4050 Executive Park Drive, Suite 220
Cincinnati, OH 45242

Personal NMLS21688 Branch NMLS2458257
Company NMLS3029

Copyright © 2025 · Powered by MySMARTblog

Copyright © 2025 · Genesis Sample Theme on Genesis Framework · WordPress · Log in