Jeff Cost

Cincinnati Home Loan

  • Home
  • About
    • About Us
    • Privacy Policy
  • Blog
  • Resources
    • First Time Seller Tips
    • First Time Buyer Tips
    • Home Appraisal
    • Loan Checklist
    • Loan Programs
    • Loan Process
    • Mortgage FAQ
    • Mortgage Glossary
    • Get a Rate Quote
    • What to Expect at a Loan Closing: A Step-by-Step Guide
  • Apply Now
    • Online Application
    • Home Purchase
    • Home Refinance
    • Loan Comparison
  • Reviews
    • Leave a Review
  • Contact

New Home Sales Rise For 7th Month Out Of 8

May 24, 2012 by Jeff Cost

New Home Supply (2011-2012)The April New Home Sales report suggests that the market for newly-built homes is as strong as the market for existing ones. 

According to the U.S. Census Bureau, the number of new homes sold rose 3.3 percent in April to a seasonally-adjusted, annualized 343,000 units sold — its second-highest reading since April 2010.

April 2010 marked the last month of that year’s federal home buyer tax credit program.

April’s New Home Sales data also marks the 7th of eight consecutive months during which the number of new homes sold climbed nationwide, a streak unequaled in recent history. During this period, the supply of new homes for sale has dropped 13%. 

The complete new home inventory is down to 146,000 homes nationwide.

At the current pace of sales, home buyers in Columbus and across the county would exhaust the complete supply of newly-built homes in 5.1 months.

This, too, is a significant figure.

When home supplies fall below 6 months of inventory, it’s widely believed to indicate a “seller’s market” and there hasn’t been more than 6 months of a new home supply since October 2011. This has placed upward pressure on new home prices and helps to explain why the average home sale price is up 9% from just 6 months ago.

Homes are selling, and they’re rising in price — a trend that today’s buyers should expect to continue through the summer and fall months.

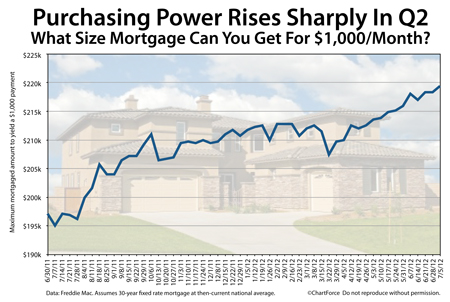
Record-low mortgage rates have moved home affordability to an all-time high with home builders now reporting the highest levels of buyer foot traffic at any time since 2007. As builder confidence grows, buyers can expect to find fewer “great deals” — especially as demand for homes outpaces supply. 

If you’re a home buyer in search of new construction, therefore, the best new construction “deals” of 2012 may be the ones you find today. By 2013, the deals may be gone.

Filed Under: Housing Analysis Tagged With: Homebuilder Confidence, New Home Sales, New Home Supply

Existing Home Sales Climb 3.4 Percent In April

May 23, 2012 by Jeff Cost

Existing Home Supply

Low mortgage rates are helping to make homes more affordable. It appears home buyers have taken notice.

According to the National Association of REALTORS®, Existing Home Sales rose 3.4% in April from the month prior, registering 4.62 million homes sold on a seasonally-adjusted, annualized basis.

An “existing home” is a home that’s been previously occupied. April’s sales volume represents a 10 percent jump from April of last year.

For buyers and sellers in Louisville , the April Existing Home Sales report supports the notion that the housing market may be improving; that the “bottom” occurred sometime in late-2011. Home values have been rising in many U.S. markets and home builders now report the highest levels of foot traffic through models since 2007.

Demand for U.S. housing is growing.

It also helps that home affordability is at an all-time high. Not in recorded history have this many homes for sale been affordable to buyers earning a moderate household income, on a percentage basis. Additionally, there is now a larger stock of homes from which buyers can choose.  

In April, the number of homes for sale nationwide jumped 9.5 percent to 2.54 million — the largest home resale inventory of the year.

At the current pace of sales, it would take 6.6 months for the complete home inventory to sell. Analysts consider a 6.0-month supply to be a market in balance. Anything less than a 6-month supply suggests a “buyer’s market”.

Home values peaked nationwide in April 2007. Since then, it’s been an uneven recovery. Some markets came back quickly, while others did not. On a neighborhood-by-neighborhood basis, even, there’s signifcant variance in how home values have fared.

In other words, although the April Existing Home Sales report indicates housing strength nationally, it’s the local data that matters most to today’s buyers and sellers. To get real-time real estate data for a particular street or area, talk with a local real estate agent.

Filed Under: Housing Analysis Tagged With: Existing Home Sales, Existing Home Supply, NAR

Home Affordability Reaches New High In Q1 2012

May 22, 2012 by Jeff Cost

Home Affordability 2005-2012Falling mortgage rates and stagnant home prices are making a positive effect on home affordability nationwide. Never before in recorded history have so many homes been affordable to households earning a moderate annual income.

Last week, the National Association of Home Builders reported the Home Opportunity Index at 77.5 — it’s highest reading of all-time. The index indicates that more than 3 of every 4 homes sold last quarter were affordable to households earning the national median income of $65,000.

Last quarter marks the 12th straight quarter — dating back to 2009 — in which the index surpassed 70. Prior to this run, the index had never crossed 70 even once.

That said, like most real estate statistics, the Home Affordability Index has a national purview. National data is of little value to homeowners in specific cities such as Cincinnati , or in specific neighborhoods such as Montgomery.

Last quarter, home affordability varied by region.

In the Midwest, for example, affordability was highest. 7 of the top 10 most affordable markets nationwide were spread throughout Ohio, Michigan, Illinois and Indiana. The top two spots, however, went to an East Region town (Cumberland) and a Pacific Northwest Region city (Fairbanks, Alaska), respectively.

The top 5 most affordable cities for home buyers in Q1 2012 were:

  1. Cumberland, MD (99.0%)
  2. Fairbanks, AK (98.9%)
  3. Wheeling, WV (97.0%)
  4. Kokomo, IN (95.8%)
  5. Indianapolis, IN (95.8%)

At #17, the Lakeland/Winter Haven, Florida area was the top-ranked South Region city last quarter.

By contrast, the Northeast Region and Southern California ranked among the least affordable housing markets — again. Led by the New York-White Plains, NY-Wayne, NJ area, 8 of the 10 least affordable areas were in the Mid-Atlantic and California, and for the 16th consecutive quarter the New York metro area was ranked “Least Affordable”.

Just 31.5 percent of homes were affordable to households earning the area median income there, up from 25.2 percent six months ago.

The rankings for all 225 metro areas are available for download on the NAHB website.

Filed Under: Housing Analysis Tagged With: HOI, Home Affordability, NAHB

  • « Previous Page
  • 1
  • …
  • 1124
  • 1125
  • 1126
  • 1127
  • 1128
  • …
  • 1201
  • Next Page »

Jeff Cost
Sr. Loan Officer

Cincinnati, OH Mortgage Lender
NMLS# 21688


jeffrey.cost@ccm.com

Call (513) 403-6260
Fax (941) 567-5222

Cross Country Mortgage

How can I help?

Connect with Me!

Browse Articles by Category

The Latest Articles

  • What Mortgage Lenders Really Look At Before Approving Your Loan
  • Steps to Take Now to Build Your Credit for a Home Purchase Next Year
  • What’s Ahead For Mortgage Rates This Week – November 3rd, 2025
  • Comparing Biweekly Payments and Lump Sum Payments to See Which Saves More
nmlsconsumeraccess.org
Equal Housing Lender

Our Location

CrossCountry Mortgage, LLC
4050 Executive Park Drive, Suite 220
Cincinnati, OH 45242

Personal NMLS21688 Branch NMLS2458257
Company NMLS3029

Copyright © 2025 · Powered by MySMARTblog

Copyright © 2025 · Genesis Sample Theme on Genesis Framework · WordPress · Log in