Jeff Cost

Cincinnati Home Loan

  • Home
  • About
    • About Us
    • Privacy Policy
  • Blog
  • Resources
    • First Time Seller Tips
    • First Time Buyer Tips
    • Home Appraisal
    • Loan Checklist
    • Loan Programs
    • Loan Process
    • Mortgage FAQ
    • Mortgage Glossary
    • Get a Rate Quote
    • What to Expect at a Loan Closing: A Step-by-Step Guide
  • Apply Now
    • Online Application
    • Home Purchase
    • Home Refinance
    • Loan Comparison
  • Reviews
    • Leave a Review
  • Contact

Behind The Housing Starts Headlines, The Story That Matters

January 20, 2012 by Jeff Cost

Housing Starts 2010-2011

When it comes to housing data, sometimes you have to look past the headlines. December’s Housing Starts data offers a terrific illustration of why.

Each month, the Census Bureau tallies Housing Starts for the month prior. A “housing start” is a home on which construction has started.

The Housing Starts report is separated by property type. There is a count for single-family homes; a count for 2-4 unit homes; and a count for buildings of 5 units or more, a category including apartments and condominiums.

In December, as reported by the government, Housing Starts fell 4 percent nationwide overall. This runs contrary to recent strength in housing and the story was quickly picked up by the press :

  • U.S. Housing Starts Fall More Than Forecast (BusinessWeek)
  • U.S. Housing Starts Fall (MarketWatch)
  • December Housing Starts Are Worse Than Expected (Fox Business)

Now, although these headlines are factually true, they’re also are a little bit misleading.

Housing Starts did fall 4 percent last month but that was for all Housing Starts, across all three property types. Data like this is somewhat irrelevant to home buyers in Kentucky or anywhere else nationwide.

Few buyers purchase 2-4 unit homes, and almost nobody purchases an entire apartment building. Rather, it’s the Housing Starts reports’ “single-family” tally that matters because that’s the home type that the majority of home buyers purchase.

In December, for the fourth straight month, Single-Family Housing Starts increased.

Single-family housing starts climbed 4 percent last month to 470,000 units on a seasonally-adjusted, annualized basis. This is the highest number of Single-Family Housing Starts since April 2010 — the last month of last year’s home buyer tax credit.

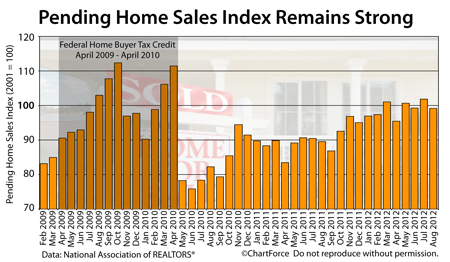
The Single-Family Housing Starts data is the latest in a series of data that point to a housing rebound nationwide. New Home Sales, Existing Home Sales, Pending Home Sales and Homebuilder Confidence has each posted multi-month highs and all are poised for strong gains into 2012.

If you’re planning to buy a home in 2012, consider buying in between now and March rather than at some point later. Home prices — and mortgage rates- are likely to move higher.

Filed Under: Housing Analysis Tagged With: Homebuilder Confidence, Housing Starts, New Home Sales

Home Builders See More Sales, Higher Prices Ahead

January 19, 2012 by Jeff Cost

Housing Market Index 2000-2012

Homebuilder confidence is soaring.

For the fourth straight month, the National Association of Homebuilders reports an increase in its Housing Market Index. The index climbed 4 points to 25 this month — its second four-point gain since October.

With home sales activity increasing across all four regions, the monthly HMI has now nearly doubled in value since June 2011.

The HMI is now at a 55-month high. 

The Housing Market Index itself is a composite reading; the result of three home builder surveys sent by the National Association of Homebuilders to its members monthly. Home builders report back on current single-family home sales volume; projected single-family home sales volume for the next 6 months; and current buyer “foot traffic”.

The NAHB then results compiles the surveys into a single reading.

In January, home builders reported improving sales conditions across all three categories :

  • Current Single-Family Sales : 25 (+3 from December)
  • Projected Single-Family Sales : 29 (+3 from December)
  • Buyer Foot Traffic : 21 (+3 from December)

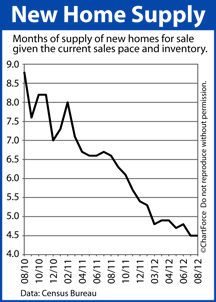
The Housing Market Index corroborates recent U.S. government data that suggests housing is mending in OH. Both Housing Starts and New Home Sales have out-performed expectations of late, it’s been shown, and the stock of new homes for sale nationwide is dwindling.

All of this, of course, is happening as demand from buyers heats up.  Foot traffic through builder homes is higher than it’s been in more than 3 years, say the builders — a time period that includes the duration of the 2010 home buyer tax credit.

It’s no surprise, therefore, that builders expect a strong 2012.

Jobs data is improving, mortgage rates remain low, and housing momentum is building. For home buyers in Louisville , however, it may spell higher home prices ahead. Big demand and small supply creates scarcity and scarcity correlates to rising prices.

If you’re shopping new homes, the best “deal” may be the one you find today.

Filed Under: Housing Analysis Tagged With: HMI, Housing Market Index, NAHB

Foreclosure Filings Fall To 49-Month Low

January 18, 2012 by Jeff Cost

Annual Foreclosure Change, Top 10 States, December 2011

Foreclosure filings are fewer these days, according to foreclosure-tracking firm RealtyTrac.

In December 2011, the number of foreclosure filings nationwide fell 9 percent from the month prior. Not since November 2007 has foreclosure activity been this sparse across the country.

The drop does not appear to be seasonal, either. 

Last month’s foreclosure filings were down 20 percent from December 2010 with “foreclosure filing” defined to include any one of the following foreclosure-related events : (1) The serving of a default notice, (2) A scheduled home auction, or (3) A bank repossession. As a result of a unexpectedly strong year-end, 2011’s annual foreclosure rate was the lowest in 4 years.

One reason why the year may have closed so strongly is that Nevada, California, Michigan and Arizona — four states typically associated with high rates of foreclosures — each posted big drops in foreclosure filings between November and December, plus double-digit drops between December 2010 and December 2011.  

In fact, among the country’s top 10 states for foreclosure activity, nine showed an annual foreclosure filing reduction.

Only Delaware worsened.

It’s also noteworthy that just 4 states accounted for half of last month’s total foreclosure filings.

  • California : 25.8 percent of all foreclosure filings
  • Florida : 12.0 percent of all foreclosure filings
  • Michigan : 6.4 percent of all foreclosure filings
  • Illinois : 6.2 percent of all foreclosure filings

Foreclosures are heavily concentrated, in other words. By contrast, the last 1% of activity is spread across 14 states.

As a Cincinnati home buyer — first-timer or investor — foreclosures can be a great way to find value.

According to the National Association of REALTORS®, distressed homes typically sell at “deep discounts” as compared to like, non-distressed homes. However, when you buy a foreclosure home from a bank, it’s different from buying a home from a “person”. Purchase contract negotiations are different and months may pass before your closing is approved.

If you’re buying foreclosure, therefore, seek the help of a professional real estate agent. Real estate agents have experience working in the process-heavy world of foreclosures and can help you come out ahead.

Filed Under: Housing Analysis Tagged With: Foreclosures, RealtyTrac, REO

  • « Previous Page
  • 1
  • …
  • 1115
  • 1116
  • 1117
  • 1118
  • 1119
  • …
  • 1165
  • Next Page »

Jeff Cost
Sr. Loan Officer

Cincinnati, OH Mortgage Lender
NMLS# 21688


jeffrey.cost@ccm.com

Call (513) 403-6260
Fax (941) 567-5222

Cross Country Mortgage

How can I help?

Connect with Me!

Browse Articles by Category

The Latest Articles

  • How Property Taxes Impact Your Mortgage Payment
  • The Impact of Inflation on Mortgage Rates and Home Affordability
  • How to Pay Off Your Mortgage 10 Years Early Without Extra Payments
  • Will Multiple Mortgage Applications Hurt Your Credit Score?
nmlsconsumeraccess.org
Equal Housing Lender

Our Location

CrossCountry Mortgage, LLC
4050 Executive Park Drive, Suite 220
Cincinnati, OH 45242

Personal NMLS21688 Branch NMLS2458257
Company NMLS3029

Copyright © 2025 · Powered by MySMARTblog

Copyright © 2025 · Genesis Sample Theme on Genesis Framework · WordPress · Log in