Jeff Cost

Cincinnati Home Loan

  • Home
  • About
    • About Us
    • Privacy Policy
  • Blog
  • Resources
    • First Time Seller Tips
    • First Time Buyer Tips
    • Home Appraisal
    • Loan Checklist
    • Loan Programs
    • Loan Process
    • Mortgage FAQ
    • Mortgage Glossary
    • Get a Rate Quote
    • What to Expect at a Loan Closing: A Step-by-Step Guide
  • Apply Now
    • Online Application
    • Home Purchase
    • Home Refinance
    • Loan Comparison
  • Reviews
    • Leave a Review
  • Contact

Home Affordability Reaches An All-Time High

March 6, 2012 by Jeff Cost

Home Opportunity Index (2005-2012)Home affordability moved higher last quarter, boosted by the lowest mortgage rates in history, a rise in median income, and slow-to-recover home prices throughout OH and the country.

According to the National Association of Home Builders, the quarterly Home Opportunity Index read 75.9 in 2011’s fourth quarter. More than 3 in 4 homes sold between October-December 2011, in other words, were affordable to households earning the national median income of $64,200.

Never in recorded history have U.S. homes been as affordable on a national level. Even on a regional and local level, affordability soared.

Affordability was highest in the Midwest; 7 of the 10 most affordable markets nationwide were in the nation’s heartland. 

The Top 5 most affordable U.S. cities in Q4 2011 were:

  1. Kokomo, IN (99.2% home affordability)
  2. Fairbanks, AK (97.5% home affordability)
  3. Cumberland, WV (96.9% home affordability)
  4. Lima, OH (96.0% home affordability)
  5. Rockford, IL (95.5% home affordability)

These are each considered “small markets”. The most affordable “major market” was the Youngstown, Ohio area, where 95.1% of homes sold were affordable to households earning the area’s local median income.

Not surprisingly, America’s “least affordable cities” were regionally-concentrated, too, with 7 of the 10 least affordable markets located in either California or Texas.

San Francisco (#3), Santa Ana (#4), and Los Angeles (#5) led for the Golden State but, for the 15th consecutive quarter, the New York metropolitan area took “Least Affordable Market” honors.

Just 29 percent of homes in and around New York City were affordable to households earning the area’s median income last quarter. It’s a large jump from the quarter prior during which 23 percent of homes were affordable.

The rankings for all 225 metro areas are available for download on the NAHB website.

Filed Under: Statistics Tagged With: Home Affordability, Home Opportunity Index, NAHB

What’s Ahead For Mortgage Rates This Week : March 5, 2012

March 5, 2012 by Jeff Cost

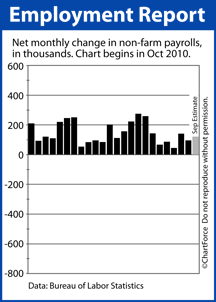
Net Non-Farm Payrolls (2010-2012)Mortgage markets worsened last week as the U.S. economy continued to show that it’s in recovery, and as Federal Reserve Chairman Ben Bernanke publicly hinted at the same.

In a congressional testimony Wednesday, Chairman Bernanke suggested that new, Fed-led stimulus may not be imminent, surprising Wall Street analysts and market traders who, for months, have expected a third round of quantitative easing from the Fed.

Bernanke’s comments sparked a sharp bond market sell-off that briefly pushed conforming and FHA mortgage rates up 0.375% in Kentucky.

Other relevant data from last week included :

  • Core inflation rising 1.9% from last year, below the Fed’s 2.0% target
  • Consumer confidence climbing to a 12-month high
  • Initial jobless claims falling to a 47-month low

Also, the Pending Home Sales Index posted its highest reading since the end of the 2010 federal home buyer tax credit, suggesting a strong spring housing market.

The economy appears much improved over this time last year.

By the end of the week, mortgage rates had recovered somewhat, but still closed worse on the week. Mortgage rates are higher than their lows of the year.

According to Freddie Mac’s weekly mortgage rate survey, the average 30-year fixed rate mortgage is now 3.90% nationwide with an accompanying 0.8 discount points and a full set of closing costs. Borrowers in Cincinnati wishing to pay no points, or fewer fees, should expect higher rates than the Freddie Mac average.

The average 15-year mortgage rate is 3.17% with 0.8 discount points and closing costs.

This week, mortgage rates should be volatile. There aren’t many new data points set for release, but the ones on the calendar are bona fide market-movers — especially Friday’s Non-Farm Payrolls Report.

More commonly called the “jobs report”, Non-Farm Payrolls data is closely watched because of the jobs market’s close ties to the health of the economy. Businesses have added jobs through 16 straight months and are expected to show another 210,000 added in February. If the actual number of net new jobs added exceeds 210,000, expect for mortgage rates to rise.

If the number falls short, watch for rates to fall.

Filed Under: Mortgage Rates Tagged With: Ben Bernanke, Non-Farm Payrolls, Pending Home Sales Index

FHA To Raise Mortgage Insurance Premiums April 1, 2012

March 2, 2012 by Jeff Cost

FHA MIP Changes April 1 2012Beginning April 1, 2012, the FHA is once again raising mortgage insurance premiums (MIP) on its newly-insured borrowers throughout Columbus and the country.

It’s the FHA’s fourth such increase in the last two years.

Beginning April 1, 2012, upfront mortgage insurance premiums will be higher by 75 basis points, or 0.75%; and annual mortgage insurance premiums will be higher by 10 basis points per year, or 0.10%.

For borrowers with a loan size of $200,000, the new MIP will add $1,500 in one-time loan costs, plus an on-going, annual $200 increase in total mortgage insurance premiums paid.

All new FHA loans are subject to the increase — purchases and refinances.

The FHA is increasing its mortgage insurance premiums because, as an entity, the FHA is insuring a much larger percentage of the U.S. mortgage market than ever before. 

In 2006, the FHA insured 2 percent of all purchase-money mortgages. In 2011, that figure jumped to 18 percent. Unfortunately, as the FHA has insured more loans, it’s number of loans in default have climbed, too, forcing the FHA to boost its reserves.

Beginning April 1, 2012, the new FHA annual mortgage insurance premium schedule is as follows :

  • 15-year loan term, loan-to-value > 90% : 0.60% MIP per year
  • 15-year loan term, loan-to-value <= 90% : 0.35% MIP per year
  • 30-year loan term, loan-to-value > 95% : 1.25% MIP per year
  • 30-year loan term, loan-to-value <= 95% : 1.20% MIP per year

In order to calculate what your FHA annual mortgage insurance premium would be on a monthly basis, multiply your beginning loan size by your insurance premium in the chart above, then divide by 12.

In addition, for loans over $625,500, beginning June 1, 2012, there is an additional 25 basis point increase to annual MIP.

To avoid paying the new FHA mortgage insurance premiums, start your FHA mortgage application today. Existing FHA-insured homeowners will not be affected by the change.

Mortgage insurance premiums will not rise for loans already made.

Filed Under: Mortgage Guidelines Tagged With: FHA, MIP, UFMIP

  • « Previous Page
  • 1
  • …
  • 1113
  • 1114
  • 1115
  • 1116
  • 1117
  • …
  • 1173
  • Next Page »

Jeff Cost
Sr. Loan Officer

Cincinnati, OH Mortgage Lender
NMLS# 21688


jeffrey.cost@ccm.com

Call (513) 403-6260
Fax (941) 567-5222

Cross Country Mortgage

How can I help?

Connect with Me!

Browse Articles by Category

The Latest Articles

  • Creative Strategies for Managing Mortgage Payments During Financial Hardship
  • Creative Ways to Use Rent-to-Own Agreements to Buy a Home
  • The Psychology of Homebuying and Emotions vs. Financial Logic
  • How to Finance Energy-Efficient Home Improvements with a Mortgage
nmlsconsumeraccess.org
Equal Housing Lender

Our Location

CrossCountry Mortgage, LLC
4050 Executive Park Drive, Suite 220
Cincinnati, OH 45242

Personal NMLS21688 Branch NMLS2458257
Company NMLS3029

Copyright © 2025 · Powered by MySMARTblog

Copyright © 2025 · Genesis Sample Theme on Genesis Framework · WordPress · Log in