Jeff Cost

Cincinnati Home Loan

  • Home
  • About
    • About Us
    • Privacy Policy
  • Blog
  • Resources
    • First Time Seller Tips
    • First Time Buyer Tips
    • Home Appraisal
    • Loan Checklist
    • Loan Programs
    • Loan Process
    • Mortgage FAQ
    • Mortgage Glossary
    • Get a Rate Quote
    • What to Expect at a Loan Closing: A Step-by-Step Guide
  • Apply Now
    • Online Application
    • Home Purchase
    • Home Refinance
    • Loan Comparison
  • Reviews
    • Leave a Review
  • Contact

Pending Home Sales Index Falls Just Short Of 100

July 27, 2012 by Jeff Cost

Pending Home Sales Index June 2012

Home sales appear headed for a mid-summer breather. 

One month after posting a multi-year high, the Pending Home Sales Index retreated to 99.3 in June — a strong reading in its own right.

A “pending home sale” is a home that is under contract to sell, but not yet sold. June’s value of 99.3 marks the 14th consecutive month during which the index showed year-to-year gains.

Last year in June, the index read 90.7.

For home buyers in Cincinnati and nationwide, the 14-month winning streak is one worth noting — specifically because the Pending Home Sales Index is different from the other housing market data that tends to make headlines.

Unlike the FHFA’s Home Price Index, for example; or the monthly New Home Sales data which both report on how housing performed in the past, the National Association of REALTORS®’ Pending Home Sales Index looks at how housing will perform in the future.

With high correlation, the Pending Home Sales Index predicts how Existing Home Sales will perform two months hence. This is because 80% of homes under contract convert to “closed sales” within 60 days of going into contract, and many of the rest convert within Months 3 and 4.

In addition, June’s near-100 reading is significant.

The Pending Home Sales Index is normalized to 100, a value which corresponds to the average home contract activity in 2001, the index’s first year of existence. 2001 was an historically-strong year for the housing market which means that June’s market action was also strong.

For today’s home buyers, the Pending Home Sales Index implies that the current market is somewhat “soft” as compared to May, a scenario which lends itself to buyer-friendly negotiations. Plus, with mortgage rates at all-time lows, home affordability has never been higher.

It’s an opportune time to buy a home in Montgomery. By next month, the market may look different.

Filed Under: Housing Analysis Tagged With: NAR, Pending Home Sales Index, PHSI

New Home Sales Slow After Fast Start To 2012

July 26, 2012 by Jeff Cost

New Home Supply 2010-2012

The number of newly-built homes sold slipped 8 percent in June from the month prior, says the U.S. Census Bureau in its latest New Home Sales report. The June data shows 350,000 homes sold nationwide on a seasonally-adjusted, annualized basis.

The home sale tally fell short of Wall Street expectations but the Census Bureau revised higher its previously-released results for March, April and May by a collective 33,000 units. This left the June New Home Sales report as the weakest of the last five months, yet still stronger than the 21 months preceding February.

In other words, despite retreating from May, the June New Home Sales data was still quite strong. As compared to June of last year, sales of newly-built homes are higher by 15% and the national inventory of new homes for sale is down to 144,000 units.

This marks a 13 percent inventory reduction in just twelve months.

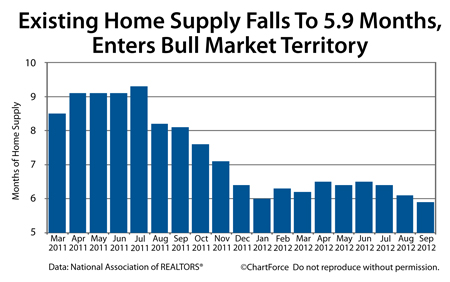
At the current sales pace nationwide, the complete stock of new homes would “sell out” in 4.9 months, a noteworthy data point because analysts believe that a 6.0-month supply of homes marks a market in balance. Home supplies of below 6.0 months suggest a “seller’s market” where sellers have pricing power and excess leverage in negotiations. 

Home supplies have been south of 6.0 months since October 2011. This is the same month that marked a shift with other housing data points, too, including Existing Home Sales and the Home Price Index.

Since October 2011, the average new home sale price is higher by 6% nationwide, a trend that should continue in Columbus through the end of 2012 and into 2013 — especially with mortgage rates at new all-time lows and home affordability at all-time highs. As more buyers enter the market amid limited supply, prices are expected to rise.

If you’re a home buyer in search of new construction, therefore, the best new home “deals” you may find may be the ones you find today.

Filed Under: Housing Analysis Tagged With: Census Bureau, New Home Sales, New Home Supply

Home Values Rise 0.8% In May 2012

July 25, 2012 by Jeff Cost

Home Price Index from peakThe housing market’s bottom is 9 months behind us. Home values continue to climb nationwide.

According to the Federal Home Finance Agency’s Home Price Index, home values rose 0.8% in May on a monthly, seasonally-adjusted basis. May’s reading marks the sixth time in seven months that home values rose.

Values are now higher by 4 percent since the market’s October 2011 bottom.

As a Louisville home buyer or seller, though, it’s important to understand what the Home Price Index measures. Or, more specifically, what the Home Price Index doesn’t measure.

Although widely-cited, the HPI remains widely-flawed, too. It should not be your sole source for real estate data.

As one example of how the Home Price Index is flawed, consider that the HPI only tracks the values of homes with an associated Fannie Mae- or Freddie Mac-backed mortgages. Homes with mortgages insured by the FHA are excluded, as are homes paid for with cash.

5 years ago, this wasn’t a big deal; the FHA insured just 4 percent of the housing market and cash sales were relatively small. Today, though, the FHA is estimated to insure more than 30% of new purchases and cash sales topped 17 percent in May 2012.

That’s a sizable subset of the U.S. housing market.

A second flaw in the Home Price Index is that it tracks home resales only and ignores new home sales. New home sales represent roughly 10% of the today’s housing market, so that’s a second sizable subset excluded from the HPI.

And, lastly, we can’t forget that the Home Price Index is on a 60-day publishing delay.

It’s nearly August, yet we’re only now receiving home valuation data from May. A lot can change in the housing market in 60 days, and it often does. The HPI is not reporting on today’s market conditions, in other words — it’s reporting on conditions as they existed two months ago. Information like that is of little use to today’s buyers and sellers in Mason.

For local, up-to-the-minute housing market data, skip the national data. Talk with a local real estate agent instead.

Since peaking in April 2007, the FHFA’s Home Price Index is off 16.0 percent.

Filed Under: Housing Analysis Tagged With: FHFA, Home Price Index, HPI

  • « Previous Page
  • 1
  • …
  • 1109
  • 1110
  • 1111
  • 1112
  • 1113
  • …
  • 1201
  • Next Page »

Jeff Cost
Sr. Loan Officer

Cincinnati, OH Mortgage Lender
NMLS# 21688


jeffrey.cost@ccm.com

Call (513) 403-6260
Fax (941) 567-5222

Cross Country Mortgage

How can I help?

Connect with Me!

Browse Articles by Category

The Latest Articles

  • Steps to Take Now to Build Your Credit for a Home Purchase Next Year
  • What’s Ahead For Mortgage Rates This Week – November 3rd, 2025
  • Comparing Biweekly Payments and Lump Sum Payments to See Which Saves More
  • Understanding the Pros and Cons of Using HELOCs to Fund Investments
nmlsconsumeraccess.org
Equal Housing Lender

Our Location

CrossCountry Mortgage, LLC
4050 Executive Park Drive, Suite 220
Cincinnati, OH 45242

Personal NMLS21688 Branch NMLS2458257
Company NMLS3029

Copyright © 2025 · Powered by MySMARTblog

Copyright © 2025 · Genesis Sample Theme on Genesis Framework · WordPress · Log in